
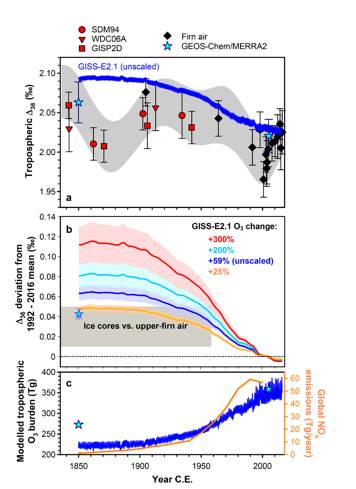
Figure : Measurement-model comparisons for increase in tropospheric O3 since 1850 C.E. (a) Comparison of best-fit tropospheric history of Δ36 values (shaded area representing the 2σ-equivalent uncertainty envelope of the inverse firn/ice model results) with measurements (black and red points). Error bars represent 1 s.e.m. computed using the pooled 1σ uncertainty and the number of replicates for each sample. The firn data point at 1905 C.E. was excluded from best-fit calculations due to potential contamination (see main text), but it is shown here to illustrate general consistency between firn- and ice-core data. Also shown are tropospheric Δ36 predictions for 1850 C.E. and 2005 C.E. derived from the GEOS-Chem/MERRA2 model (cyan stars, with 1σ error bars corresponding to uncertainty in the stratospheric Δ36 input; see Methods) and the mean temporal evolution of the tropospheric Δ36 value derived from the GISS-E2.1 model (blue line). (b) Hypothesis tests for the global simulations showing compatibility with the firn- and ice-core data only when the O3 increase since 1850 C.E. is limited, e.g., +25% for GISS-E2.1. Time-traces are 5-year moving averages and shaded areas represent 1σ uncertainty in the stratospheric Δ36 input. (c) Modeled increase in tropospheric O3 burden from the GEOS-Chem/MERRA2 (cyan stars) and GISS-E2.1 models (blue line), plotted with estimates of historical NOx emissions from ref. 29 (orange line).
Tropospheric ozone (O3) is key component of air pollution and an important anthropogenic greenhouse gas. During the 20th century, proliferation of the internal combustion engine, rapid industrialization, and land-use change led to a global-scale increase in its concentrations, but the magnitude of this increase is not known. Atmospheric chemistry models typically predict an increase in the tropospheric O3 burden of less than 50% since 1900,1,2 while direct measurements made in the late 19th century imply that surface O3 mixing ratios increased by much more, up to 300%3-5. Improvements in model chemistry have reduced disparities somewhat6,7, but the accuracy and diagnostic power of the measurements remains controversial8. Here, we place limits on the 20th-century increase in tropospheric O3 using a record of the clumped-isotope composition of molecular oxygen (18O18O in O2) trapped in polar firn and ice. We find that proportions of 18O18O in O2 decreased by 0.03 ± 0.02‰ below their 1590 – 1958 C.E. mean during the second half of the 20th century, implying that tropospheric O3 increased less than 40% during that time. These results corroborate model predictions of global-scale increases in surface pollution and vegetative stress caused by increasing anthropogenic emissions of O3 precursors1,2,9. The radiative forcing due to tropospheric O3 since 1850 C.E. is likely less than +0.4 W m-2, placing limits on the impact of air-quality regulation as a global warming mitigation strategy.
Authors : Laurence Y. Yeung, Lee. T. Murray, Patricia Martinerie, Emmanuel Witrant, Huanting Hu, Asmita Banerjee, Anaïs Orsi, and Jérôme Chappellaz.
Ref. : Nature, vol. 570, no 7760, p. 224, 2019
• Laboratoire des Sciences du Climat et de l'Environnement
• Ice and Continents, Climates and Stable Isotopes (to be translated) • Glaces, Climats et Isotopes Stables
![]() PHoCEA DRF - All rights reserved - Legal notice - Privacy policy - Last update: Apr 16th, 2024
PHoCEA DRF - All rights reserved - Legal notice - Privacy policy - Last update: Apr 16th, 2024
