A recent study by an international research team led by ETH Zurich and involving researchers from the Laboratory of Climate and Environmental Sciences (LSCE-IPSL) has shown that in 2023, The oceans absorbed nearly one billion tons less CO2 than expected based on previous years. This corresponds to approximately half of the EU’s total CO2 emissions. This approximately 10% decrease in the ocean sink is a direct consequence of extreme sea surface temperatures in 2023 in the extratropical regions of the northern hemisphere, particularly in the North Atlantic.
To date, the oceans have absorbed around a quarter of CO2 emissions from human activities. Without this sink, the concentration of CO2 in the atmosphere would be much higher and global warming would already have far exceeded the 1.5°C limit. At the same time, the ocean absorbs around 90% of the additional heat from the atmosphere. They thus help to stabilize the global climate system.
In 2023, ocean surface temperatures reached record levels over large areas. The tropical Pacific was very warm due to a strong El Niño event. At the same time, oceans outside the tropics, particularly the North Atlantic, also warmed exceptionally. While the impact of regular El Niño events on the ocean CO2 sink has been well documented since the 1980s, the effect of record temperatures in extratropical areas is much less understood. An international research team, with the participation of the LSCE, has for the first time quantified the impact of extreme temperatures on the ocean CO2 sink on a global scale.
In the study published in the journal Nature Climate Change, researchers show that in 2023, the oceans absorbed nearly one billion tons of CO2 less than expected based on previous years. This change in the ocean sink reflects the overlap of the El Niño episode and high temperatures in the northern extratropical latitudes. El Niño tends to enhance the overall carbon sink capacity of the oceans. Its influence on the CO2 sink is explained by the weakening of circulation in the tropical Pacific, preventing cold, CO2-rich waters from rising to the surface. As a result, the eastern tropical Pacific, which normally releases very large amounts of CO2 into the atmosphere, emits virtually none during El Niño years.
But during 2023, on a global scale, the El Niño effect was largely mitigated by a decrease in the oceanic CO2 sink in the extratropical regions of the northern hemisphere, particularly in the North Atlantic. High temperatures reduced the solubility of CO2, leading to CO2 degassing. However, as illustrated during an El Niño event, whether the ocean absorbs or releases CO2 does not depend solely on temperature. Physical and biological processes in the ocean also play a role, offsetting CO2 release and strengthening the CO2 sink.
These processes reduce the concentration of dissolved inorganic carbon (DIC) in the surface layers. The ocean’s response to the extreme temperatures of 2023 therefore reflects the combination of two effects: temperature-induced degassing and the depletion of dissolved CO2 in the ocean’s surface layer. While the effect of temperature is currently offset by processes that reduce DIC, the future evolution of the ocean sink in a warmer climate remains uncertain. The effectiveness of compensatory mechanisms in limiting CO2 release linked to temperature extremes remains an open question.
Pour en savoir plus
References and notes
1. Müller et al. (2025) Unexpected decline in the ocean carbon sink under record-high sea surface temperatures in 2023. Nat. Clim. Change 15, 978–985. https://doi.org/10.1038/s41558-025-02380-4
N. B. : Cette étude est la première à quantifier la réponse du puits de CO2 océanique aux extrêmes de température à l’échelle globale. Elle s’est appuyée sur les observations de CO2 effectuées à partir de navires de recherche, de cargos et de bouées de mesure (2), combinées à des données satellitaires et à l’apprentissage automatique (3), afin d’établir des cartes mondiales des niveaux de CO2 en surface. Cela leur a permis de calculer les flux de CO2 entre l’eau et l’air à la surface de la mer.
2. Bakker et al. (2016) A multi-decade record of high quality fCO2 data in version 3 of the Surface Ocean CO2 Atlas (SOCAT). Earth System Science Data 8, 383-413. doi:10.5194/essd-8-383-2016. Les observations de CO2 de surface sont contrôlées et compilées annuellement dans la base de données internationale SOCAT à laquelle communauté française contribue activement.
3. Notamment les sorties du réseau de neurones développé au LSCE (Chau et al. (2024) CMEMS-LSCE: a global, 0.25°, monthly reconstruction of the surface ocean carbonate system, Earth Syst. Sci. Data, 16, 121–160, https://doi.org/10.5194/essd-16-121-2024, 2024), distribuées par le portail CMEMS
https://data.marine.copernicus.eu/product/MULTIOBS_GLO_BIO_CARBON_SURFACE_MYNRT_015_008/description
Contacts
Marion Gehlen, LSCE-IPSL •
Frederic Chevallier, LSCE-IPSL •
Laboratoire des Sciences du Climat et de l’Environnement – LSCE-IPSL

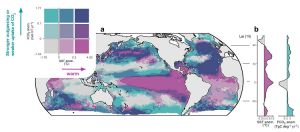
Fig. Caption
Map of the world’s oceans (a) showing anomalies in CO2 fluxes and sea surface temperatures (SST) for the year 2023 compared to the linear trend (1990-2022). (b) Latitudes with high temperatures (pink) and low CO2 absorption due to degassing (turquoise). (Graphic: Jens Daniel Müller / ETH Zurich)