
Constraining the mass balance of the Antarctic ice sheet is essential to predicting future sea level rise. Projections are typically obtained by modelling the two components of the mass balance separately: ice discharge into the ocean, and the net accumulation of snow over the continent, i.e., the surface mass balance (SMB). Because SMB observations remain sparse over the ice sheet, limited-area models (LAMs) are widely employed in mass balance studies. However, the global models used to force these LAMs exhibit biases in general circulation at high southern latitudes. Bias correction methods, including iterative approaches, can partially mitigate these biases.
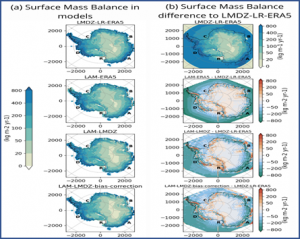
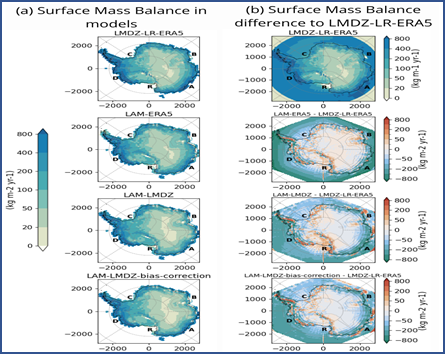
Four model configurations are evaluated: a global LMDZ simulation nudged toward the ERA5 reanalysis, and three LAM simulations forced respectively by ERA5, a free-running global LMDZ simulation, and a global LMDZ simulation with iterative bias correction (Krinner et al. 2026). The global configuration is found to be significantly wetter than the LAM configurations, as reflected by significant differences in ice-sheet-integrated simulated SMB. An anomalous precipitation deficit near the domain boundaries is identified in the ERA5-forced LAM, along with an error in the sea ice definition within the LAM configurations (Fig. 1).
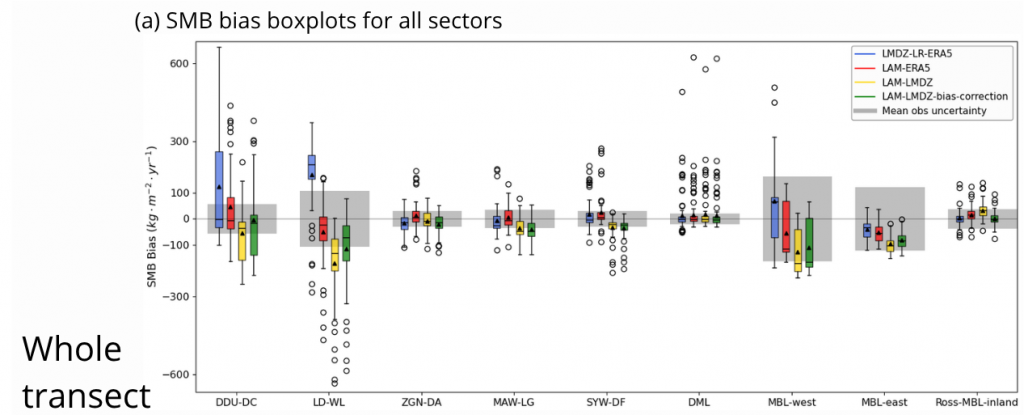
An analysis conducted across transects and sectors indicates that iterative bias correction effectively reduces bias in the coastal region, but not over the continental interior, where negative biases persist. Model performance varies substantially as a function of elevation zone. A statistical test implemented for this purpose does not identify any single model configuration as consistently superior (Fig. 2). Finally, the transect-based approach does not account for a substantial number of coastal observations that are predominantly located on ice shelves.
Krinner et al. (2026) GMD https://doi.org/10.5194/gmd-19-4961-2026