The Amazon rainforest is one of the most complex ecosystems on Earth. Its biodiversity, rainfall variability, and diverse soils shape forest dynamics in ways that are only partly captured by dynamic global vegetation models (DGVMs). Observations reveal a strong gradient in aboveground biomass (AGB): higher biomass in the northeast over the Guiana Shield—where nitrogen-fixing, large-seeded legume trees dominate—and lower biomass in the drier southwest, where faster-growing non-legumes thrive. Yet, most DGVMs fail to reproduce this gradient. This limitation raises concerns about the ability of models to predict how Amazonian forests will respond to future climate and land-use changes.
A new approach to parameter optimization
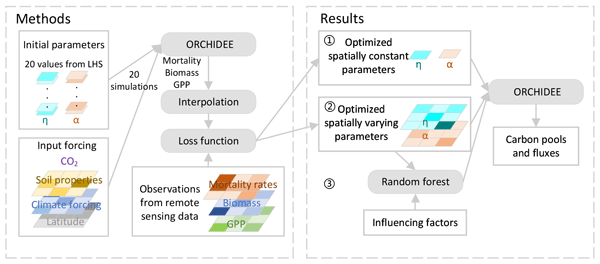
In this study, we used satellite observations of tree AGB, gross primary productivity (GPP), and biomass mortality to optimize two key model parameters in the DGVM ORCHIDEE:
• α (alpha self-thinning): controls tree mortality from light competition.
• η (nitrogen use efficiency of photosynthesis): regulates GPP.
By adjusting these parameters at the level of model pixels, we tested whether spatial variability in these parameters is sufficient to capture AGB gradients.
Model performance: constant vs. spatially varying parameters
With spatially varying parameters, ORCHIDEE successfully reproduces observed spatial patterns of AGB (R² = 0.82), GPP (R² = 0.79), and biomass mortality (R² = 0.73). By contrast, simulations with constant parameters fail to capture these patterns (R² < 0.04 for all variables). This highlights the importance of accounting for within-PFT variability when modeling Amazon forests.
Linking parameters to ecological drivers
To explore the cause of PFT parameters variability, we applied explainable machine learning (random forest regression with SHAP values), which was able to explain 47% of the variation in α and 48% in η (on the testing data sample). Wood density shows the highest feature importance for α, based on mean absolute SHAP values, which is in line with empirical evidence that forests with higher wood density tend to have lower mortality rates and higher biomass. Additionally, MCWD emerges as the most important feature for η, but current theoretical understanding is insufficient to validate this relationship, which highlights the need for further research in this area.
Implications for land surface modeling
Our method accounted for parameter variations within the PFT, an important factor that has largely been overlooked in other models. Except for optimizing the parameters, this approach also helps identify the missing or underrepresented processes in the model. Given the complexity of Amazonian forests, it is not feasible to represent every process in detail. However, allowing parameters to vary in space offers a practical step forward in capturing the region’s heterogeneity and improving predictions of its carbon cycle under global change.
Flowchart for the parameter optimization. η: nitrogen use efficiency; α: alpha self-thinning; LHS: Latin hypercube sampling; GPP: gross primary productivity.
Full article : https://gmd.copernicus.org/articles/18/4915/2025/
Contact: Lei Zhu (LSCE)