Tree ring δ18O chronologies from two native species (Fitzroya cupressoides and Nothofagus pumilio) in northern Patagonia were developed to assess their potential for paleoclimate reconstructions. The five annually resolved cellulose chronologies of oxygen isotopic compositions (d18Ocell; two for F. cupressoides and three for N. pumilio) are located on the Andes along the steep west-to-east precipitation gradient. Over the common 60 years long interval, the five site-d18Ocell chronologies exhibit a strong common signal as indicated by the significant mean intercorrelation (r = 0.61, p<0.05) and the high percentage (65%) of total variance explained by the first empirical orthogonal function.
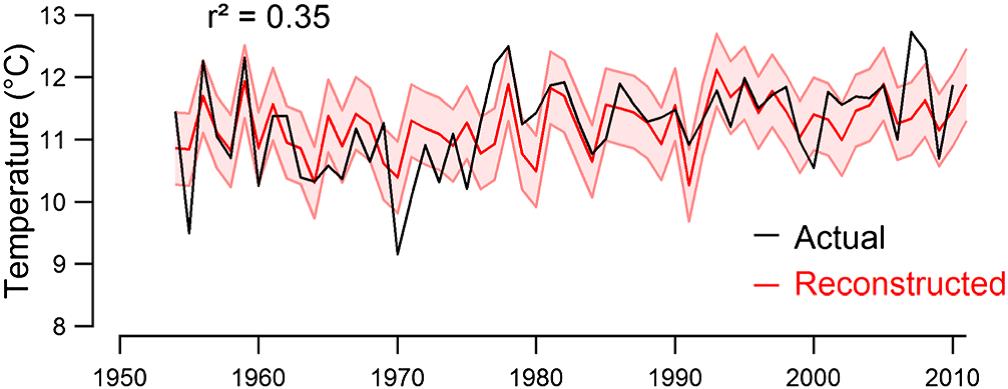
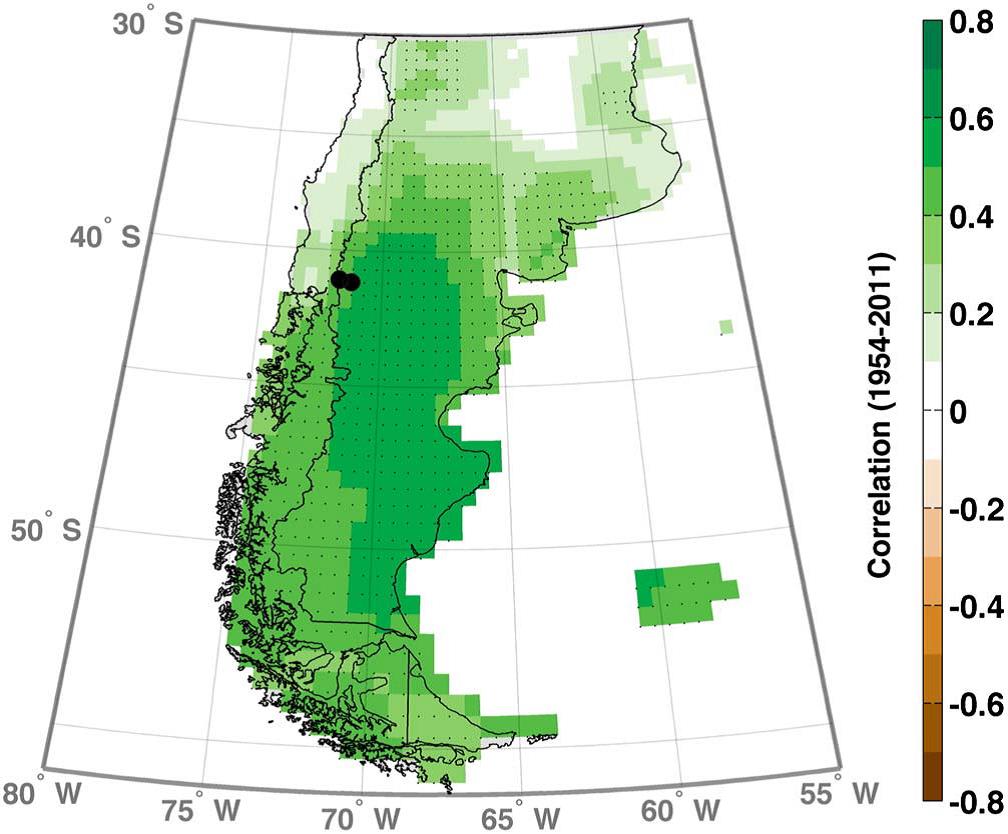
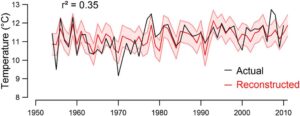
Although correlation analyses reveal that the two mean species-d18Ocell chronologies are mainly modulated by December–May temperature, the N. pumilio chronology shows a greater sensitivity to record temperature variations (r = 0.57, p<0.05; Fig. 1). The d18Ocell of N. pumilio contains a regional temperature signal representative of a large area in southern South America under the influence of the Southern Annular Mode (Fig. 2). This study indicates that d18Ocell in N. pumilio is a promising proxy to reconstruct past variations in temperature in South America south of 38°S.
[1] LSCE, Glaccios
[2], IANIGLA-CONICET, Mendoza, Argentina